Zenduty Integration Guide
Overview
Integrating UptimeObserver with Zenduty enables seamless incident management by automatically creating and resolving incidents based on your website's uptime status. When a monitor detects downtime, an incident is created in Zenduty; when the monitor recovers, the incident is automatically resolved.
Note
Zenduty integration is available on all UptimeObserver plans.
Support
If you need help with this integration please reach out to us using the "Need Help?" button on the bottom right corner or send us an email at support@uptimeobserver.com.
Step-by-Step Guide
In Zenduty:
- Go to Teams on Zenduty and click on the team you want to add the integration to.
- Then, go to Services and click on the relevant Service.
- Go to Integrations and then Add Incoming Integration. Give it a name and select the application Generic Integration from the dropdown menu.
- Go to Configure under your integrations and copy the generated Webhook URL.
In UptimeObserver:
- Go to UptimeObserver and log in to your account.
- Navigate to the Integrations section from your dashboard.
- Select Webhooks from the list of available integration options.
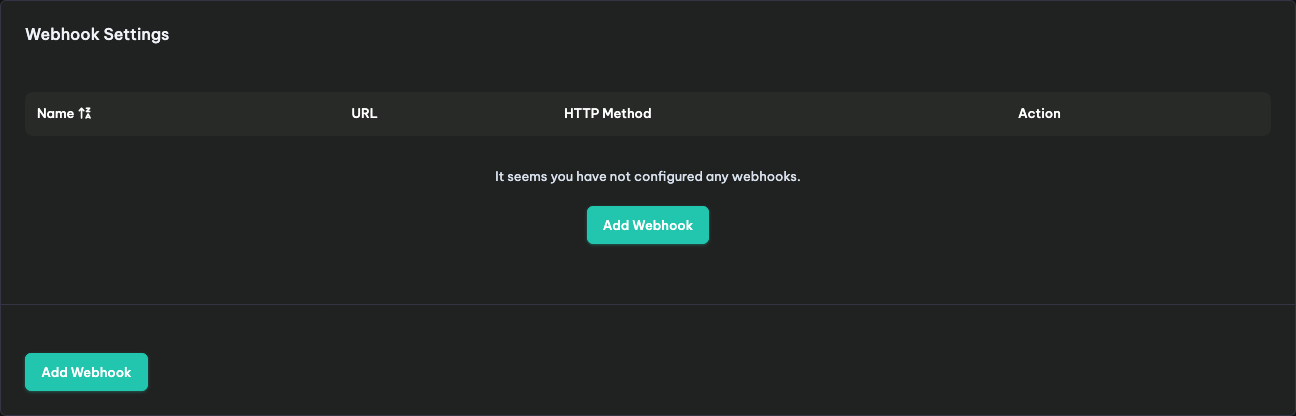
- You’ll need to create two webhooks:
- One for declaring an incident
- Another for resolving an incident
1. Incident Webhook Setup
Incident Webhook should be used by the Monitor Down event.
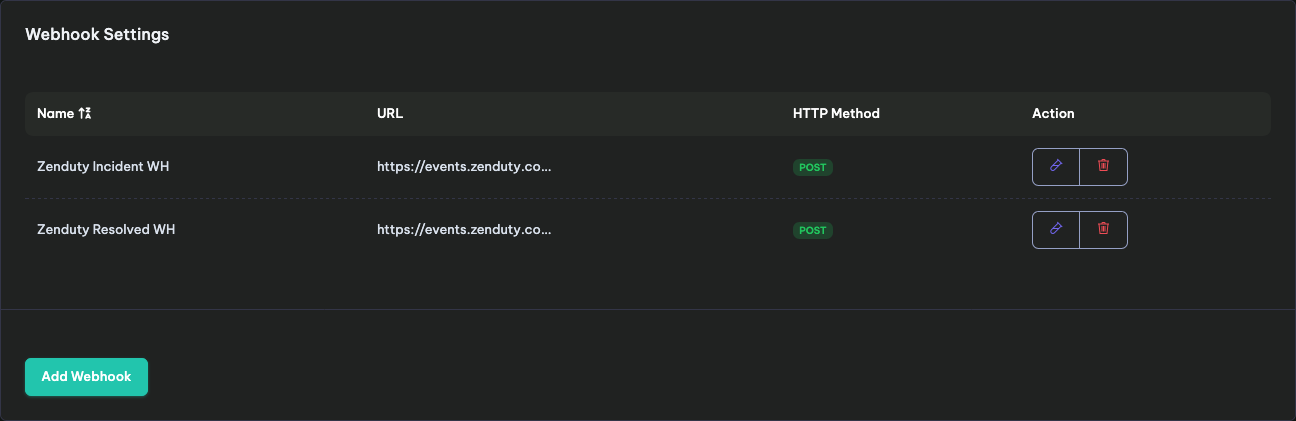
- Friendly name : Zenduty Incident WH
- URL : The url copied earlier (example : https://events.zenduty.com/integration/aaaaa/generic/aaaaaaaa-aaaa-aaaa-aaaa-aaaaaaaaaaaa/)
- HTTP Method : POST
- Authentication : None
- HTTP Body Encoding : application/json
- HTTP Body
7.Click Save Webhook, then test it using the Test Button 🧪.
{
    "alert_type": "critical",
    "message": "Incident on __MONITOR_FRIENDLY_NAME__",
    "entity_id": __INCIDENT_ID__,
    "payload": {
    },
    "urls": [
        {
            "link_url": "__INCIDENT_URL__",
            "link_text": "Incident URL"
        },
        {
            "link_url": "__MONITOR_URL__",
            "link_text": "__MONITOR_FRIENDLY_NAME__"
        }
    ]
}
2. Resolution Webhook Setup
Resolution Webhook should be used by the Monitor Up event.
- Friendly name : Zenduty Resolved WH
- URL : The url copied earlier (example : https://events.zenduty.com/integration/aaaaa/generic/aaaaaaaa-aaaa-aaaa-aaaa-aaaaaaaaaaaa/)
- HTTP Method : POST
- Authentication : None
- HTTP Body Encoding : application/json
-
HTTP Body
{ "alert_type": "resolved", "message": "Incident on __MONITOR_FRIENDLY_NAME__", "entity_id": __INCIDENT_ID__, "payload": { }, "urls": [ { "link_url": "__INCIDENT_URL__", "link_text": "Incident URL" }, { "link_url": "__MONITOR_URL__", "link_text": "__MONITOR_FRIENDLY_NAME__" } ] } -
Click Save Webhook, then test it using the Test Button 🧪.
Once completed, your Zenduty + UptimeObserver integration is ready to automatically manage incidents in real-time!
Enabling Alerts on Monitors
After configuring your webhooks, you must add them as alerts to your monitors:
- Navigate to your monitor in the UptimeObserver dashboard.
- Scroll down to the Monitor Alerts section.
- Click Add Alert.
- Configure the incident alert:
- Alert Type: Webhook
- Event: Monitor Down
- Webhook: Select Zenduty Incident WH
- Click Save Changes.
- Add another alert for resolution:
- Alert Type: Webhook
- Event: Monitor Up
- Webhook: Select Zenduty Resolved WH
- Click Save Changes.
Recommendation
Always configure both "Monitor Down" and "Monitor Up" alerts to ensure incidents are automatically created and resolved in Zenduty.
Troubleshooting
If you are having trouble with the integration, check the common solutions below.
1. Test Button Failed or Webhook Not Working
If the test button fails or you receive an error:
- Check the Webhook URL: Ensure you copied the complete Zenduty webhook URL including the trailing slash
- Verify the URL format: The URL should look like
https://events.zenduty.com/integration/.../generic/.../ - JSON formatting: Ensure the HTTP Body is valid JSON—check for missing commas or brackets
- Try regenerating: In Zenduty, delete the integration and create a new one with a fresh webhook URL
2. Incidents Not Being Created in Zenduty
If monitors go down but no incident appears in Zenduty:
- Alert not added to monitor: Verify the webhook is added as an alert on the monitor. Go to Monitor Detail → Alerts
- Wrong event selected: Ensure you selected "Monitor Down" for the incident webhook
- Check Zenduty service: Verify the service in Zenduty is active and not in maintenance mode
- Team assignment: Confirm the service is assigned to an active team in Zenduty
3. Incidents Not Being Resolved Automatically
If incidents are created but not resolved when the monitor recovers:
- Missing resolution webhook: You need both webhooks configured—one for "Monitor Down" and one for "Monitor Up"
- Alert not added: Verify the resolution webhook is added as an alert with the "Monitor Up" event
- Same entity_id: Ensure both webhooks use
__INCIDENT_ID__for theentity_idfield so Zenduty can match incidents - Manual resolution: If someone manually resolved the incident in Zenduty, UptimeObserver's resolution won't affect it
4. Wrong Alert Type in Zenduty
If incidents appear but with wrong severity:
- Check alert_type: The incident webhook should have
"alert_type": "critical"and the resolution webhook should have"alert_type": "resolved" - Other alert types: Zenduty supports
critical,warning,error,info, andresolved. Adjust as needed for your workflow
5. Webhook URL Invalid or Expired
If you receive 404 or authentication errors:
- Integration deleted: The webhook URL becomes invalid if the integration is deleted in Zenduty
- Re-create integration: Go to Zenduty → Services → Integrations and create a new Generic Integration
- Update UptimeObserver: Copy the new webhook URL and update both webhooks in UptimeObserver
6. How to Reset the Integration
If all else fails, try a fresh start:
- Delete both webhooks in UptimeObserver
- Delete the Generic Integration in Zenduty
- Follow the Step-by-Step Guide to set up a fresh integration
How to Uninstall
In Zenduty:
- Go to Teams on Zenduty and click on the team with the integration.
- Then, go to Services and click on the relevant Service.
- Go to Integrations and select the Integration. Then click Settings and delete the integration.
In UptimeObserver:
- Go to UptimeObserver and log in to your account.
- Navigate to the Integrations section from your dashboard.
- Select Webhooks from the list of available integration options.
- Delete both the incident and resolution webhooks.