Webhooks Integration Guide
Overview
Integrating UptimeObserver with Webhooks enables real-time, automated communication between your uptime monitoring and any external services. Webhooks allow you to send HTTP requests to any URL when monitor events occur, enabling integration with virtually any system that accepts HTTP requests.
Note
Webhooks integration is available on all UptimeObserver plans.
Support
If you need help with this integration please reach out to us using the "Need Help?" button on the bottom right corner or send us an email at support@uptimeobserver.com.
Step-by-Step Guide
- Go to UptimeObserver and log in to your account.
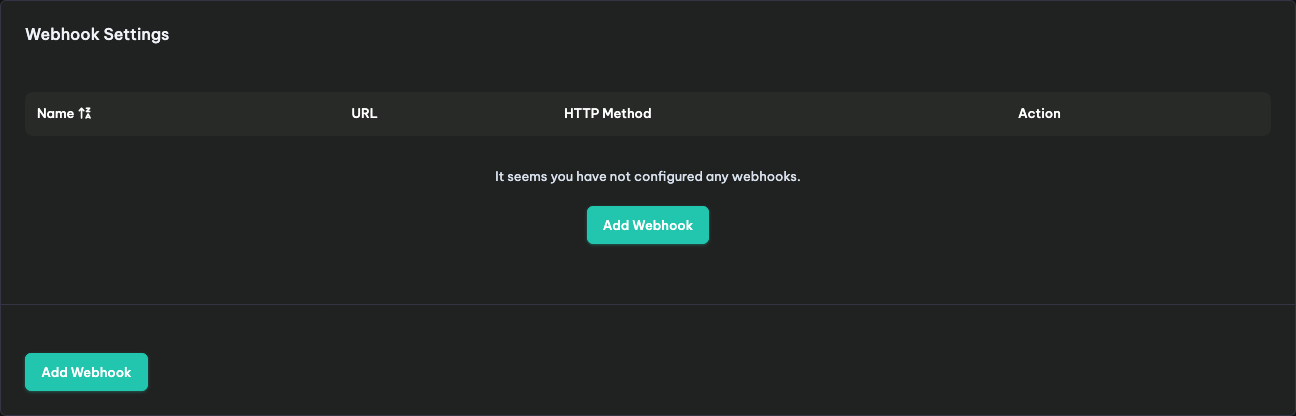
- Navigate to the Integrations section from your dashboard.
- Select Webhooks from the list of available integration options.
- You'll need to create two webhooks:
- One for declaring an incident
- Another for resolving an incident
1. Incident Webhook Setup
Incident Webhook should be used by the Monitor Down event.
- Friendly name: Declare Incident WH
- URL: the webhook URL of your target service
- HTTP Method: POST
- Authentication: None. If you need to authenticate you can choose Basic Auth or Bearer.
- HTTP Body Encoding: application/json
- HTTP Body: Customize the body to match your target webhook's expected format.
{ "incident_url": "__INCIDENT_URL__", "incident_id": __INCIDENT_ID__, "title": "Incident on __MONITOR_FRIENDLY_NAME__", "description": "Incident on __MONITOR_FRIENDLY_NAME__. Root Cause: __INCIDENT_ROOT_CAUSE__", "incident_status": "__INCIDENT_STATUS__", "monitor_id": __MONITOR_ID__, "monitor_name": "__MONITOR_FRIENDLY_NAME__", "monitor_url": "__MONITOR_URL__" } - Click Save Webhook, then test it using the Test Button 🧪.
2. Resolution Webhook Setup
Resolution Webhook should be used by the Monitor Up event.
- Friendly name: Resolve Incident WH
- URL: the webhook URL of your target service
- HTTP Method: POST
- Authentication: None. If you need to authenticate you can choose Basic Auth or Bearer.
- HTTP Body Encoding: application/json
- HTTP Body: Customize the body to match your target webhook's expected format.
{ "incident_url": "__INCIDENT_URL__", "incident_id": __INCIDENT_ID__, "title": "Resolved: __MONITOR_FRIENDLY_NAME__", "description": "Incident on __MONITOR_FRIENDLY_NAME__ has been resolved.", "incident_status": "__INCIDENT_STATUS__", "monitor_id": __MONITOR_ID__, "monitor_name": "__MONITOR_FRIENDLY_NAME__", "monitor_url": "__MONITOR_URL__" } - Click Save Webhook, then test it using the Test Button 🧪.
Once completed, your Webhook integration is ready to automatically manage incidents in real-time!
Available Variables
You can use these variables in your webhook body:
__MONITOR_FRIENDLY_NAME__- The name of your monitor__INCIDENT_URL__- Direct link to the incident details__INCIDENT_ROOT_CAUSE__- The reason for the incident__INCIDENT_STATUS__- Current status of the incident__MONITOR_URL__- URL being monitored__MONITOR_ID__- Unique monitor identifier__INCIDENT_ID__- Unique incident identifier
Enabling Alerts on Monitors
After configuring your webhooks, follow these steps to add alerts to your monitor:
- Navigate to your monitor.
- Scroll down to the Monitor Alerts section.
- Click Add Alert.
- Set the following parameters:
- Alert Type: Webhook
- Event: Monitor Down
- Webhook: Select Declare Incident WH
- Click Save Changes.
- Repeat the process to add another alert:
- Alert Type: Webhook
- Event: Monitor Up
- Webhook: Select Resolve Incident WH
Everything is now set up—your webhooks will be triggered automatically based on the selected monitor events.
Troubleshooting
If you are having trouble with webhooks, check the common solutions below.
1. Test Button Failed (Connection Errors)
If the test button fails with a connection error:
- Check the URL: Verify the webhook URL is correct and accessible from the internet
- HTTPS issues: If using HTTPS, ensure the SSL certificate is valid and not self-signed
- Firewall rules: The target server must accept incoming connections from UptimeObserver's IPs (see Bot documentation for IP addresses)
- Timeout: The webhook endpoint must respond within a reasonable time (typically 30 seconds)
2. HTTP 401 Unauthorized
If you receive a 401 error:
- Missing authentication: If your endpoint requires authentication, configure Basic Auth or Bearer token in UptimeObserver
- Wrong credentials: Double-check your username/password for Basic Auth or the token for Bearer authentication
- Token format: For Bearer authentication, enter only the token value without the "Bearer " prefix
3. HTTP 403 Forbidden
If you receive a 403 error:
- IP not whitelisted: Your target service may require IP whitelisting. Add UptimeObserver's IPs to your allowlist
- Authentication scope: Your credentials may not have permission to access the webhook endpoint
- Rate limiting: Some services block requests that appear automated—contact the target service provider
4. HTTP 404 Not Found
If you receive a 404 error:
- Wrong URL: Verify the webhook URL is correct, including any path segments
- Endpoint removed: The webhook endpoint may have been deleted or changed on the target service
- Trailing slash: Some services require (or reject) a trailing slash in the URL—try both
5. HTTP 500 Internal Server Error
If you receive a 500 error:
- Invalid JSON: Ensure your HTTP Body is valid JSON with properly quoted keys
- Unexpected format: The target service may expect a different payload structure—check the service's documentation
- Server issues: The target service may be experiencing problems—check their status page
6. Webhook Works but Notifications Don't Appear
If webhooks succeed (200 OK) but you don't see the expected result:
- Payload format: The target service may require specific field names or structures
- Content-Type header: Ensure HTTP Body Encoding matches what the target expects (usually
application/json) - Check target service logs: Review logs on your target service to see how the webhook was processed
7. Invalid JSON Errors
If you get JSON parsing errors:
- Quote all string keys: JSON requires double-quoted keys:
"key": "value"notkey: "value" - Number variables: Variables like
__INCIDENT_ID__are numbers—don't wrap them in quotes - String variables: Variables like
__MONITOR_URL__are strings—wrap them in quotes - Check for trailing commas: JSON doesn't allow trailing commas after the last item
8. Webhook Triggers But Wrong Data
If the webhook fires but contains wrong information:
- Check variable names: Ensure variable names are spelled correctly with double underscores on both sides
- Test with real incident: Some variables only populate during real incidents, not test calls
- Check event type: Make sure "Monitor Down" triggers your incident webhook, not your resolution webhook
9. How to Reset the Integration
If all else fails, try a fresh start:
- Delete the problematic webhooks in UptimeObserver
- Create new webhooks with fresh configurations
- Test each webhook individually before adding them to monitors
How to Uninstall
In UptimeObserver:
- Go to UptimeObserver and log in to your account.
- Navigate to the Integrations section from your dashboard.
- Select Webhooks from the list of available integration options.
- Delete both the incident and resolution webhooks.
On Your Target Service:
Depending on the service, you may also want to remove any webhook endpoints or integrations you created specifically for UptimeObserver.